Welcome to the second DC Origins–themed installment of “The Curve Dissected.” The previous article dealt with individual characters at individual points on the cost curve. In contrast, this article will wrap up the series by examining the curve as a whole and relating it to teams and gameplay.
We're going to look at three pairs of figures for each cost level from 1 to 9. The first pair of figures is the increase in average ATK and the increase in average DEF from the previous cost level. This gives us an actual reference for the numbers—they're real statistical averages, so they're easy to understand.
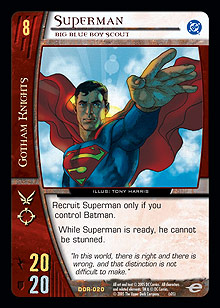 The second pair of figures is the average ATK and the average DEF, in terms of the potential maximum ATK and potential maximum DEF a character in DC Origins can have. The highest printed ATK and DEF values are on Trigon, The Terrible and Superman, Big Blue Boy Scout: 20 for both characters and both values. Since 20 is the maximum printed ATK or DEF any character has, 20 represents 100 percent of the potential ATK or potential DEF a character could have. If a character were to have 10 ATK or DEF, then its ATK or DEF in terms of potential ATK or potential DEF would be 50 percent. This second pair of figures expresses the averages for an entire cost level in terms of potential ATK and potential DEF.
The third pair of figures is a measurement of difference between the potential ATK of the cost level being examined and the cost level that came before it, and same figures regarding DEF.
In short, the first pair of figures shows the increase in stats between levels. The second pair of figures shows where that cost level lies on the curve, expressed as a percentage. The third pair of figures shows growth between levels in terms of the complete curve.
Got it? I hope so!
Let's get started with the first cost level.
Cost Level 1
Increase in average ATK from last cost level: N/A
Increase in average DEF from last cost level: N/A
Average ATK in terms of potential ATK: 4.47%
Average DEF in terms of potential DEF: 5.525%
Difference in potential ATK from last cost level: N/A
Difference in potential DEF from last cost level: N/A
 There's not much to see, since it's the first level. It is worth noting that on the first ninth of the curve, we see an average ATK and average DEF that represent approximately one-twentieth of the overall potential ATK and potential DEF. The curve really does move fast enough to cover 95 percent of its growth in just eight levels. This means that 1-drop characters are simply not going to be worth playing in some decks. They should only be used if they fill a specific need, either with one of their own effects or by their interactions with other cards. This may seem obvious, but it's always nice to see the numbers behind the reasoning.
It's also definitely worth playing characters that either work well together or fit the theme of your deck. The League of Assassins might want to play 1-drop characters to meet its loyalty requirements, Gotham Knights will want characters to exhaust to pay for Bat-Signals (or they'll just want Alfred Pennyworth), Teen Titans will want characters to pump up other Titans, and Arkham Inmates will probably want a 1-drop character like Harley Quinn to abuse Kidnapping as early as possible.
Cost Level 2
Increase in average ATK from last cost level: 1.158
Increase in average DEF from last cost level: 1.158
Average ATK in terms of potential ATK: 10.26%
Average DEF in terms of potential DEF: 11.315%
Difference in potential ATK from last cost level: 5.79%
Difference in potential DEF from last cost level: 5.79%
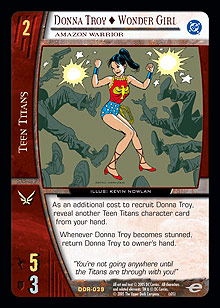 The curve hasn't actually started curving at this point, which means two things. First, it means that teams or decks with a weak first two turns or decks that miss a drop in either of those turns probably won't be hurting too badly. It also means that the Teen Titans are astoundingly strong on turn 2, due to the presence of Donna Troy ◊ Wonder Girl. As a 5 ATK/3 DEF powerhouse, Donna beats the curve by almost fifteen percent of the potential ATK and potential DEF, outclassing the average ATK and average DEF of turn 3 by a whopping six to seven percent.
In other words, it's safe to play with characters that are more concerned with performing tricks, such as Talia and Mad Hatter, unless you're facing the Teen Titans. Depending on the deck, an off-affiliation 2-drop character can also be a decent option. For instance, Puppet Master has many positive interactions in an Arkham Inmates deck.
Cost Level 3
Increase in average ATK from last cost level: 1.698
Increase in average DEF from last cost level: 1.549
Average ATK in terms of potential ATK: 18.75%
Average DEF in terms of potential DEF: 19.06%
Difference in potential ATK from last cost level: 8.49%
Difference in potential DEF from last cost level: 7.745%
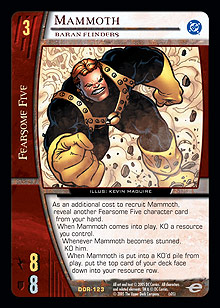 Now the stakes are getting higher. We've gone from gains of about five percent in turns 1 and 2 to gains of about eight percent in terms of potential ATK and potential DEF, and though that may seem slow, the momentum will build quickly. At nearly 20 percent of the potential ATK and potential DEF, the average statistic values are becoming dangerous. The Gotham Knights come out strong with Batman, World's Greatest Detective, and the League of Assassins boasts Ubu. The Arkham Inmates team is fragile but threatening with Charaxes. Though the Teen Titans are relatively weak at this level, Roy Harper ◊ Arsenal can make them difficult to approach, while Beast Boy can take some lumps without complaining. But the Fearsome Five affiliation has the 3-drop character to watch out for in Mammoth, who eats everyone else for breakfast. With